India RE Map | September 2018

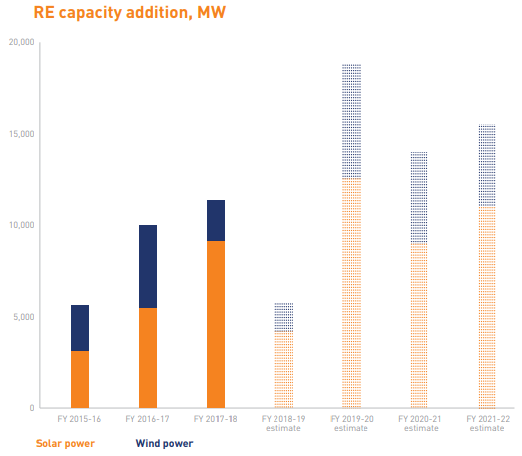
This is our first combined wind and solar info-graphic report. India added total utility scale wind and solar capacity of 9.5 GW in the last 12 months (down almost 20% y-o-y).


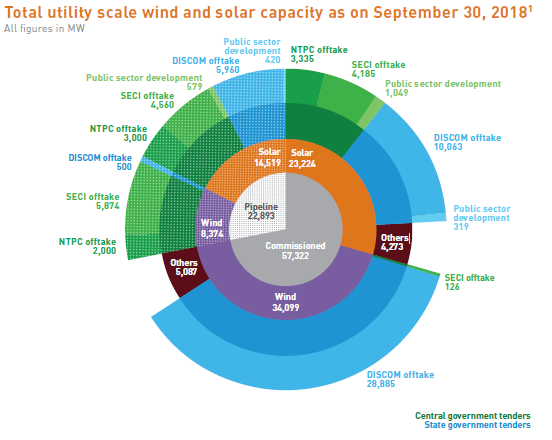
The report provides a complete snapshot of the sector including installed and pipeline capacity breakdown by state, historic growth, leading states, key players and their market shares, tender results and our growth estimates for the next four years.


Recent reports

India Corporate Renewable Brief | Q4 2022   

This report provides a quarterly update on key trends and developments in the corporate renewable market including capacity addition, key players, pol...

Buy Report Download Executive Summary

India PV Module Intelligence Brief | Q4 2022   

This report captures quarterly trends in module demand and supply, import and domestic production volumes, supplier market shares, break-up by tech...

Buy Report

India Solar Compass | Q4 2022   

This report provides a detailed update of all key sector developments and trends in the quarter – capacity addition, leading players, tenders and po...

Buy Report Download Executive Summary

India Corporate Renewable Market   

India’s corporate renewable market is becoming more vibrant with strong demand, policy and technology levers. Driven by net zero targets and investo...

Buy Report Download Executive Summary

Green Hydrogen – Early Growth Opportunities   

Green hydrogen is a versatile fuel which may be used as an energy store, fuel and feedstock across multiple sectors. Refining and fertiliser industrie...

Buy Report Download Executive Summary

A business case for renewable energy certificates for Indian companies to meet RE 100 targets

C&I consumers account for 53% of power consumption but only 6% of this requirement is met from direct procurement of renewable power. In face of m...

Download
We use cookies to offer you an optimal user experience and collect information on website usage.