In Q1 2021, daytime power prices in southern Australia fell repeatedly below zero between 10 am and 3:30 pm. The negative prices came on back of low power demand and increasing renewable power penetration in the country (28% in 2020). In Germany too, where Q1 renewable power penetration crossed 50%, frequency of negative price points has been increasing. In March 2020, the country logged 130 hours of negative prices due to high wind power production, up 44% over March 2019. Similar events are now witnessed with increasing regularity in many other countries across Europe and USA.
Most countries are struggling to cope with intermittency risk of renewable power;
In India, various initiatives to improve grid resilience have made little headway so far due to high policy inertia, low technical expertise and unwillingness to bear extra costs;
Without proactive planning, the problem would escalate disproportionately over time and affect growth prospects of the sector;
With increasing share of renewable power, residual power demand has come to resemble the famous “duck” curve, posing problems for grid managers and conventional power producers. While renewable power usually enjoys guaranteed feed-in-tariffs (FITs) or ‘must run’ status, inflexible coal-fired plants face a tough choice: expensive cycle of daily shutdowns and restarts, or payments to consumers to be able to despatch power i.e., negative prices. The affected countries are responding in different ways – building storage capacity, increasing reliance on flexible gas-fired power, undertaking demand side management, and/ or increasing trading in ancillary services and other grid flexibility services. But renewable power is not getting away scot free either. Germany has imposed restriction on FIT payments, while the Netherlands has said that it would not pay incentives to solar and wind power plants if power prices turn negative. In the UK, ‘constraint payments’ to wind power plants are becoming controversial.
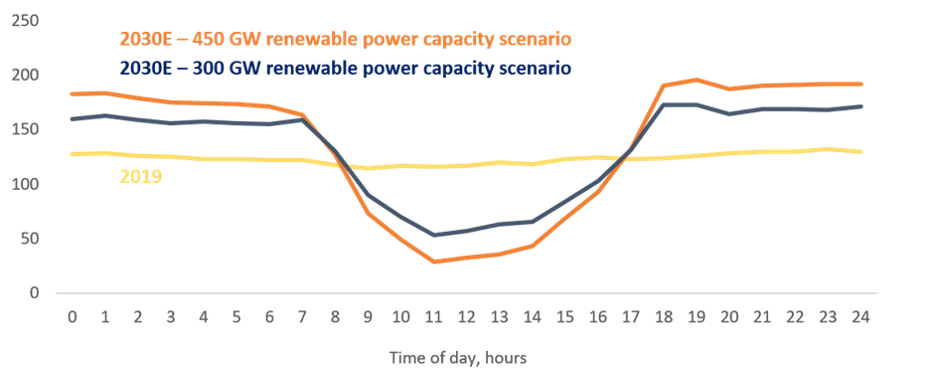
In India, with relatively low renewable penetration of about 10%, the problem seems somewhat distant. There is a view that launch of green power exchange and the option of exporting surplus power across states or even neighbouring countries would provide sufficient system flexibility. But high price of old contracted power and transmission system constraints are formidable barriers. DISCOMs in RE-rich states – penetration in Karnataka, Andhra Pradesh and Tamil Nadu has already touched 40%, 22% and 21% respectively – are turning to curtailment with various estimates suggesting annual incidence as high as 15% in some states. Meanwhile, the ominous ‘duck’ curve is bound to get significantly worse in the coming years (see chart below).
Figure: National power demand to be met from coal-fired plants on a summer day, GW
Source: NLDC, BRIDGE TO INDIA research Notes: 2030 scenarios assume unchanged gas-fired power supply and 100% diversion of hydro power output to peak demand hours.
There have been multiple pilots, research studies and consultation exercises over the years to examine feasibility of demand side management, flexible thermal power generation and cheaper gas-fired power. But there is no tangible progress. Reasons include high policy inertia, low technical and management expertise, poor quality data and unwillingness to bear extra costs.
Table: Status of key measures to improve grid resilience
Source: BRIDGE TO INDIA research
Lack of urgency on this front should worry all stakeholders. Absent proactive planning, the problem would escalate rapidly. DISCOMs are already getting reluctant to buy more renewable power affecting growth prospects of the sector.
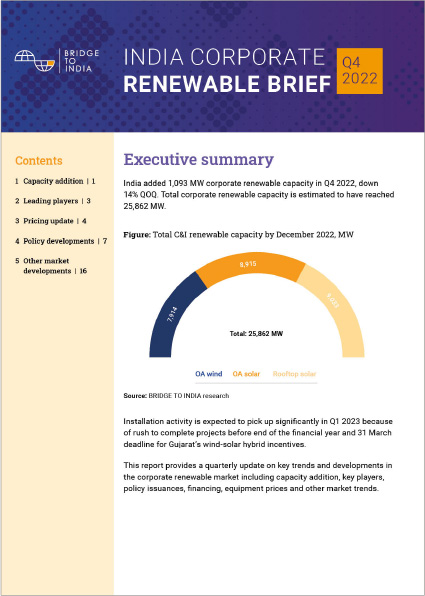
This report provides a quarterly update on key trends and developments in the corporate renewable market including capacity addition, key players, pol...
This report provides a detailed update of all key sector developments and trends in the quarter – capacity addition, leading players, tenders and po...
India’s corporate renewable market is becoming more vibrant with strong demand, policy and technology levers. Driven by net zero targets and investo...
Green hydrogen is a versatile fuel which may be used as an energy store, fuel and feedstock across multiple sectors. Refining and fertiliser industrie...
A business case for renewable energy certificates for Indian companies to meet RE 100 targets
C&I consumers account for 53% of power consumption but only 6% of this requirement is met from direct procurement of renewable power. In face of m
Price :
Apply now
Register
Arrange Trial Session
Developing a corporate renewable procurement roadmap
Register Now
Advanced clean energy technologies
Register Now
We use cookies to offer you an optimal user experience and collect information on website usage.
Login
Or
Sign up
Sign up to our free monthly bulletin, blogs and reports
Terms and conditions
Introduction
These terms and conditions govern your use of our website – bridgetoindia.com. By using our website, you accept these terms and conditions in full; if you disagree with any part of these terms and conditions, you must not use our website.
You must be at least 18 years of age to use our website; by using our website, you warrant and represent to us that you are at least 18 years of age.
Our details
This website is owned and operated by BRIDGE TO INDIA Energy Private Limited.
We are registered in India under registration number CIN: U40106 HR2008 PTC058267, and our registered office is at C8/5 DLF 1, Gurugram 122001, INDIA.
Our principal place of business is at C8/5 DLF 1, Gurugram 122001, INDIA.
Our GST number is 06AADCB 6783 D1ZQ.
You can contact us by post at the address given above or by telephone on +91-124-420-4003 or by email at contact@bridgetoindia.com
Ownership and licence to use
All information and content on our website is owned exclusively by us. We reserve the right to discontinue or alter any or all of the website content at any time.
The website contents are protected by Indian copyright and international copyright/intellectual property laws under applicable treaties and/or conventions.
We grant you a personal, non-exclusive, non-transferable licence to use the website.
We reserve the right to restrict access to our website at our discretion; you must not circumvent or bypass, or attempt to circumvent or bypass, any such access restriction measures.
Acceptable use
You must not edit or modify any material on our website.
You must not:
sell, rent or sub-license material from our website;
share, reproduce or copy any material from our website without our express written consent.
You must not:
use our website in any way or take any action that causes, or may cause, damage to the website or impairment of the performance, availability or accessibility of the website;
use our website in any way that is unlawful, illegal, fraudulent or harmful;
conduct any systematic or automated data collection activities (including without limitation scraping, data mining, data extraction and data harvesting) on or in relation to our website;
use data collected from our website for any direct marketing activity (including without limitation email marketing, SMS marketing, telemarketing and direct mailing).
Limited warranties
We do not warrant or represent completeness or accuracy of the information published on our website. The information available on our website is of general use and may not be suitable for you.
We aim to provide accurate and up-to-date information but are not legally liable for the accuracy of such information.
You use our website at your own risk.
To the maximum extent permitted by applicable law, we exclude all representations and warranties relating to the subject matter of these terms and conditions, our website and the use of our website.
Registration and accounts
You may register for an account with our website by completing and submitting the account registration form on our website.
You must keep your password confidential.
You must not use any other person's account to access the website.
You must not allow any other person to use your account to access the website.
You must notify us in writing immediately if you become aware of any unauthorised use of your account.
We may suspend or cancel your account at any time in our sole discretion without notice or explanation.
Purchases
All purchases made on this website are non-refundable and non-exchangeable.
Your content
In these terms and conditions, "your content" means all information and materials (including without limitation text, graphics, images, audio material, video material, audio-visual material, scripts, software and files) that you submit to us for storage or publication on, processing by, or transmission via, our website.
You grant to us a worldwide, irrevocable, non-exclusive, royalty-free licence to reproduce, store and, with your specific consent, publish your content on our website.
You warrant and represent that your content will comply with these terms and conditions. Your content must not be illegal or unlawful, must not infringe any person's legal rights, and must not be capable of giving rise to legal action against any person (in each case in any jurisdiction and under any applicable law).
Your content, and the use of your content by us in accordance with these terms and conditions, must not:
infringe any copyright, trade mark or other intellectual property right;
be in breach of any contractual obligation owed to any person;
be untrue, false, inaccurate or misleading;
Privacy
Information collection and use - For a better experience while using our website, we may require you to provide us with certain personally identifiable information, including but not limited to your name, phone number and email address. The information that we collect may be used to contact or identify you.
If you use our website, you agree to the collection and use of information in relation with these terms and conditions. The personal information collected by us is used for providing and improving our services. We will not use or share your information with anyone except as described here.
Log data - Whenever you visit our website, we collect information that your browser sends to us including your computer’s Internet Protocol address, pages of our website visited by you, the time and date of your visit, the time spent on those pages, and other statistics.
Cookies – these are files with small amount of data that is commonly used as anonymous unique identifier. These are sent to your browser from the website and are stored on your computer’s hard drive. Our website uses these “cookies” to collection information and to improve our website. You have the option to either accept or refuse these cookies and know when a cookie is being sent to your computer. If you choose to refuse our cookies, you may not be able to use some portions of our Service.
Service providers - We may employ third-party companies and individuals to improve or repair our website and to assist with running our business activities etc. These third parties may have access to your personal information to perform the tasks assigned by us to them. However, they are obligated not to disclose or use the information for any other purpose.
We may suspend or cancel your account at any time in our sole discretion without notice or explanation.
Security - We value your personal information and strive to protect it and keep it confidential. But as no technology or system can be 100% secure and reliable, we cannot guarantee absolute security of your personal information.
Links to other sites - Our website may contain links to other sites. These external sites are not operated by us and we have no control over, and assume no responsibility for their content, privacy policies, or any other business practices.
Children’s privacy - Our website does not serve anyone under the age of 18. We do not knowingly collect personal identifiable information from children under 18. If you are a parent or guardian and you are aware that your child has provided us with personal information, please contact us so that we can delete their information and take any other necessary actions.
Breach of these terms and conditions
Without prejudice to our other rights under these terms and conditions, if you breach these terms and conditions in any way, or if we reasonably suspect that you have breached these terms and conditions in any way, we may suspend your access to our website, prohibit you permanently from accessing our website and/or commence suitable legal action against you, whether for breach of contract or otherwise.
Where we suspend or prohibit or block your access to our website or a part of our website, you must not take any action to circumvent such suspension or prohibition or blocking (including without limitation [creating and/or using a different account).
Amendments
We may revise these terms and conditions from time to time.
The revised terms and conditions shall apply to the use of our website from the date of publication of the revised terms and conditions on the website, and you hereby waive any right you may otherwise have to be notified of, or to consent to, revisions of these terms and conditions.
Privacy
You hereby agree that we may assign, transfer, sub-contract or otherwise deal with our rights and/or obligations under these terms and conditions.
You may not without our prior written consent assign, transfer, sub-contract or otherwise deal with any of your rights and/or obligations under these terms and conditions.
If a provision of these terms and conditions is determined by any court or other competent authority to be unlawful and/or unenforceable, other provisions will continue in effect.
The exercise of your and our rights under these terms and conditions is not subject to the consent of any third party.
The terms and conditions constitute the entire agreement between you and us in relation to your use of our website and supersede all such previous agreements between you and us.
These terms and conditions shall be governed by and construed in accordance with Indian Law.
Any disputes relating to these terms and conditions shall be subject to the exclusive jurisdiction of the courts of India.