


It has been a little over three months since renewable power trading commenced on Indian Energy Exchange. Trading has been active for solar and non-solar renewable power separately under two different contracts – intra-day, for delivery within 3.5 hours, and day-ahead, for delivery next day. Longer-term contracts – daily, for delivery between 2-10 days ahead, and weekly, for delivery from Monday to Sunday – commenced only this week.
- Trading volume has stayed low at about 2,000 MW daily, about 2.5% of total renewable power output;
- Buyers are unprepared to pay a huge premium over conventional power restricting sales appetite of DISCOMs with surplus contracted power;
- Trading should pick up by gradually as significant new generation capacity comes online in the next year;
There are some clear trends visible from a look at the trading data so far. As expected, trading volume has stayed low at about 2,000 MW daily, about 2.5% of total renewable power output, or just 3% of total power traded during the same period and 35% of RECs traded during the same period last year. Solar power has enjoyed majority share (88%) in the traded volume because of greater predictability. Average price for solar and non-solar power was INR 3.47/ kWh and INR 3.77/ kWh respectively, significantly higher than conventional power traded price of INR 2.72/ kWh.
Buying interest has exceeded selling interest by a factor of more than 3x, coming in mainly from renewable power deficit DISCOMs. Top four buyers include DISCOMs in Haryana (28%), Kolkata (CESC, 20%), Mumbai (Tata Power, 10%) and Delhi (BSES Rajdhani, 7%) together accounting for two-third of total volume. Large corporate consumers like Vedanta, Dalmia Cement, Jindal Steel and Tata Steel have also been active trying to meet their RPO requirements. The real surprise is that on the seller side, Telangana has accounted for 73% of traded volume with Karnataka (9%) being the only other DISCOM to have sold power. Smaller IPPs had a share of around 15% in the traded volume.
Figure: Renewable power traded volume and price
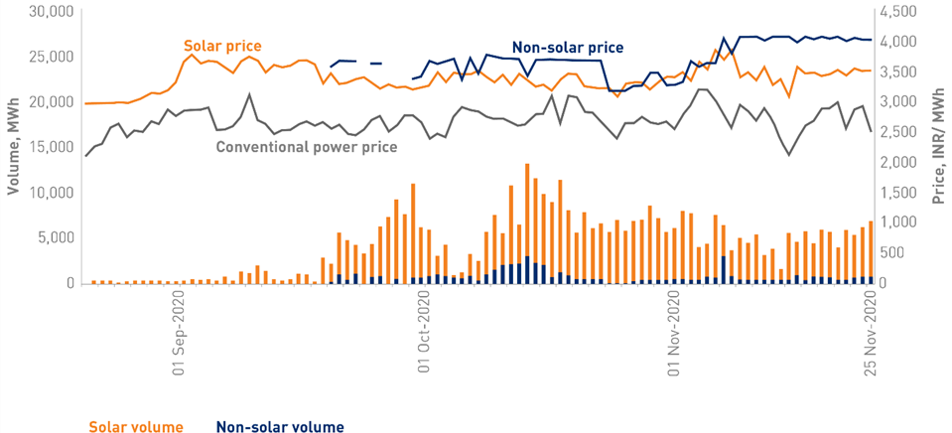
Source: Indian Energy Exchange
Selling interest is low both because of lack of merchant capacity and low prices. IPPs do not have any untied capacity. Main selling interest is therefore coming from DISCOMs with excess supply of power but in most cases, average cost of their contracted power is in excess of INR 4.50/ kWh and presumably, they are not prepared to sell at a loss. Onerous forecasting and scheduling requirements are also inhibiting volume growth. No schedule revision is allowed under intra-day and day-ahead contracts. Revisions are allowed for daily and weekly contracts but with at least two days advance notice.
Exchange trading of renewable power is a positive development but volumes are expected to stay low. Next year could see a marginal improvement as power demand revives and significant new generation capacity comes online.


