


Open access and rooftop solar can potentially meet only about 40-50% of a corporate consumer’s power requirement due to a temporal mismatch between supply and demand. Consumers keen to increase share of renewables in their consumption mix to achieve decarbonisation goals must therefore find alternative sources. Unfortunately, some of the key options to address intermittency risk of renewable power are not deemed viable. Banking power with the grid is increasingly not possible as DISCOMs and state regulators make such provisions more restrictive. Deployment of battery storage at scale is still not cost effective particularly with growing shortage of key raw materials and increase in prices. In light of these developments, role of the green power exchange to meet consumer demand becomes potentially very significant. It can also be a useful option for consumers not keen on or unable to sign long-term PPAs.
Green power trading has grown significantly in the last two years. Coal shortage and increase in price of thermal power are providing further impetus to this market. The Ministry of Power move to exempt ISTS charges for all power traded on exchanges until June 2025, yet to be approved by CERC, is also helpful in this regard. This market has attracted strong buying interest from both DISCOMs and consumers (Vedanta, Jindal Steel, SAIL among the top participants).
Different market segments
Amongst the different instruments – ranging from intra-day to weekly delivery – for trading power on the exchanges, the Green-Day Ahead Market (G-DAM) for next day delivery is the most active (see chart below). Demand and traded volume have been higher (24%) than the Green-Term Ahead Market (G-TAM) which enjoys priority in transmission capacity allocation and longer trading duration. Within G-TAM too, bulk of trading volume is seen in day-ahead and intra-day markets due to shorter forecast horizon and low risk of deviation penalties.
Figure: Trading volume and prices on green power exchange in April 2022
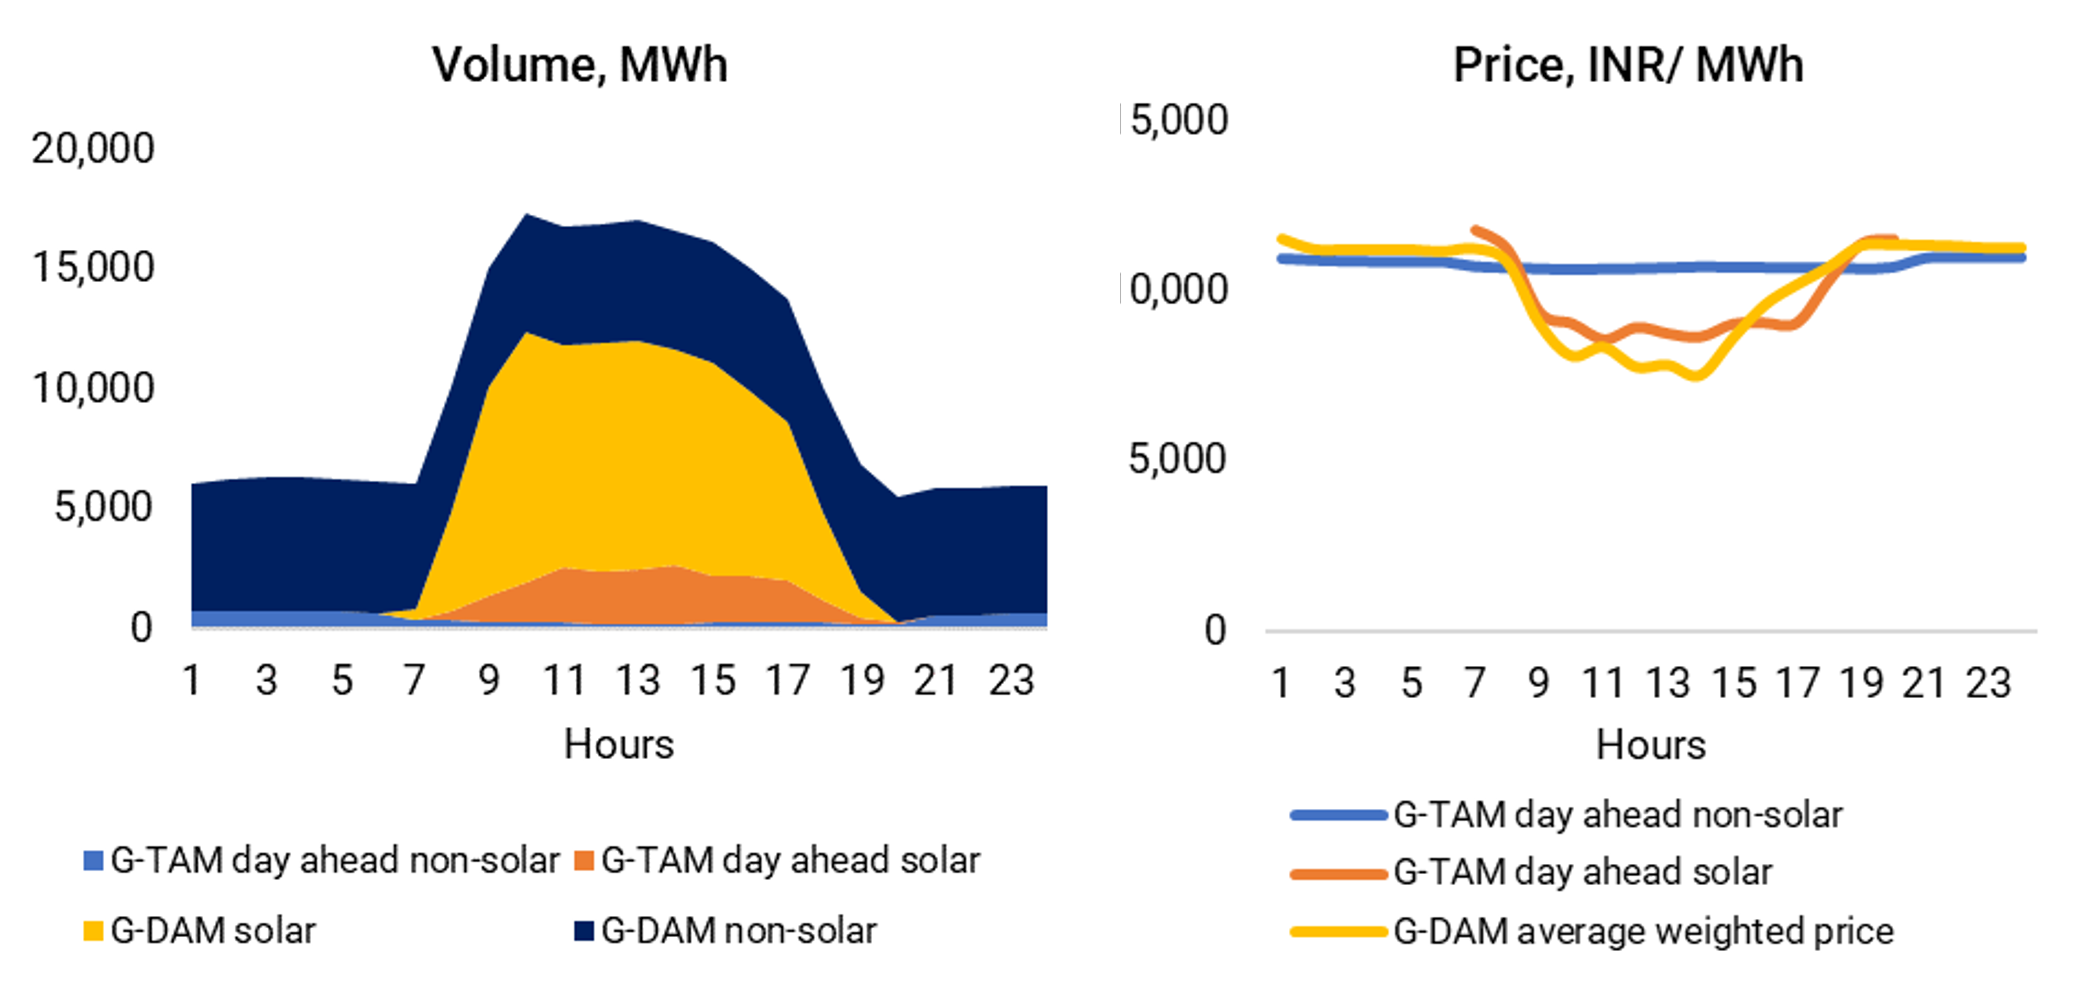
Source: Indian Energy Exchange
Note: Indian Energy Exchange accounts for about 95% share of total renewable power traded on the exchanges.
Lack of liquidity
Despite steady pick up in trading volumes, total green power trading volume is still relatively small. Only 3% of total renewable power output (5.5 TWh) renewable power was traded on the exchanges in FY 2022. This is mainly due to lack of untied capacity. Selling interest is confined mainly to a few DISCOMs that have contracted renewable power in excess of their RPO requirements and projects with generation surplus to their PPA requirement.
Volatile power prices
Trading power on exchange exposes consumers to price volatility. Traded prices increased sharply from INR 5/ kWh in Feb 2022 to more than INR 9/ kWh in March 2022 due to jump in demand and limited thermal supply. It is worth noting that prices are lower around mid-day than at other times. Consequently, consumers looking to sell any surplus solar power during the day and buy power at other times to match their demand profile face a negative price differential. This difference is bound to get worse as more solar capacity gets added in the country.
Green power trading market is expected to grow and mature over time. Perhaps the most encouraging aspect is that many project developers are looking to build projects on a pure ‘merchant’ basis or with short-term PPAs. To benefit from this option, consumers must develop better in-house capability to predict their forward demand and trade power on the exchanges.


