Loading...

India Solar Compass Q4 2020


25 February 2021 | BRIDGE TO INDIA

India Solar Compass Q4 2020

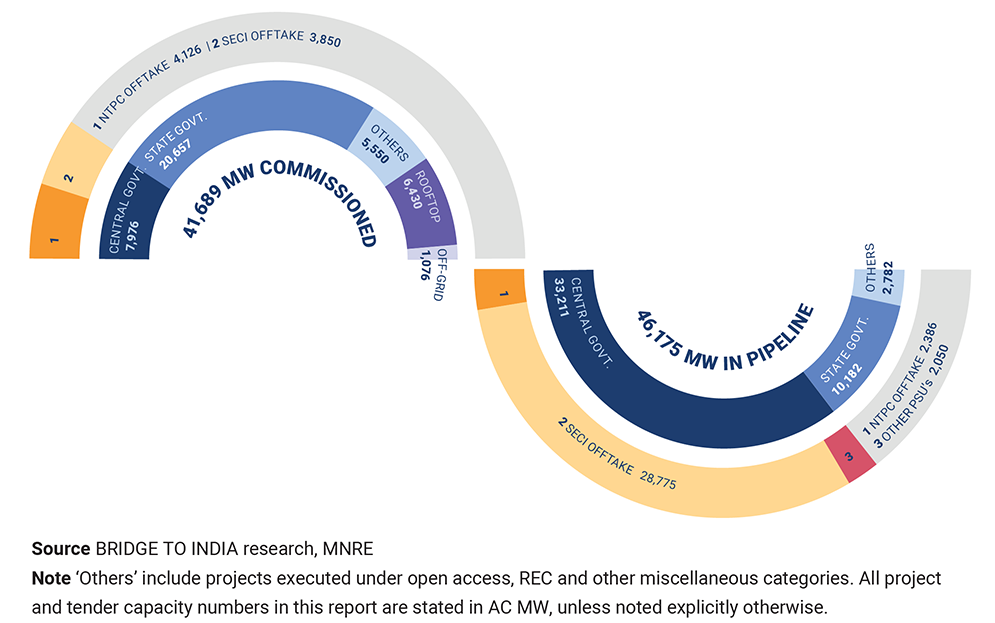
Coronavirus-induced hardships persisted in Q4 2020, pulling installation numbers down. Solar capacity addition in 2020 was at a five-year low. 1,298 MW of new capacity was added in the quarter, marginally below our estimate. Total installed capacity and project pipeline touched 41,689 MW and 46,175 MW, respectively by 31 December 2020.

Figure: Total installed and pipeline capacity by 31 December 2020, MW

Increase in module prices, other project costs coupled with COVID-induced operational and financial challenges continue to stall project construction activity. We expect construction pace to pick up in 2021 with record capacity addition of 16,000 MW in the year.

Reluctance of DISCOMs to sign PPAs is a concern with as much as 19,000 MW of auctioned projects yet to be tied-up. However, tender issuance and project auctions in Q4 were relatively robust at 32,014 MW and 28,050 MW, respectively. The quarter was notable for record low tariffs of INR 1.99-2.01/ kWh in the GUVNL 500 MW and SECI Rajasthan 1,070 MW auctions. Tariffs have dipped by 54% over last five years and by 18% over the last year. The low tariffs distort future tariff expectations of DISCOMs and raise risk of project cancellation or contract renegotiations.

This report provides a detailed update of all sector trends and developments in the quarter – ranging from capacity addition, leading players, tender and policy announcements, equipment prices, policy announcements, financial deals and other market developments. The report also provides market outlook for the next two quarters.

The report can be purchased online or by writing to us at market.research@bridgetoindia.com.


Recent reports

India Renewable Map | June 2023

India Renewable Map | June 2023

India’s total utility scale solar and wind capacity reached 101,763 MW by 30 June 2023. New capacity addition in the last 12 months was 10,099 MW, down by 26% y-o-y. Total project pipeline stands at 74,315 MW. Figure: Total utility scale solar and wind capacity as on 30 June 2023 Source: BRIDGE TO INDIA research This info-graphic report provides a complete overview of the...

India PV Module Intelligence Brief | Q2 2023

India PV Module Intelligence Brief | Q2 2023

This report captures quarterly trends in module demand and supply, import and domestic production volumes, supplier market shares, break-up by technology and rating, global market scenario, pricing trends across the value chain, key policy developments and market outlook.

India Solar Compass | Q2 2023

India Solar Compass | Q2 2023

This report provides a detailed update of all key sector developments and trends in the quarter – capacity addition, leading players, tenders and policy announcements, equipment prices, financial deals and other market developments. It also provides market outlook for the next two quarters.

India Corporate Renewable Brief | Q2 2023

India Corporate Renewable Brief | Q2 2023

This report provides an update on key trends and developments in the corporate renewable market including capacity addition, key players, policy issuances, financing, equipment prices and other market trends.

Merchant market for renewable projects

Merchant market for renewable projects

Many project developers are increasingly keen to participate in the merchant power market because of attractive prices on the exchanges and intense competition for PPAs. New project structures like RTC and VPPAs are also leading to a rise in project capacities with untied power output.

India PV Module Intelligence Brief | Q1 2023

India PV Module Intelligence Brief | Q1 2023

This report captures quarterly trends in module demand and supply, import and domestic production volumes, supplier market shares, break-up by technology and rating, pricing trends across the value chain, key international developments and short-term market outlook.

To top