


Gujarat has announced a new solar policy for the next five years. The policy breaks away from many conventional features in similar state policies. On the positive side, the state has removed all project sizing restrictions for all consumers and investors irrespective of end use for power. OPEX projects are allowed grid connectivity unlike earlier. But the state has dealt a huge blow by imposing all grid charges including transmission and wheeling charges, Cross Subsidy Surcharge (CSS) and Additional Surcharge (AS) on OPEX projects and then also introducing a new penal definition of “captive” projects. Similarly, banking has been allowed with severe limitations and cost.
- The decision to do away with project capacity caps and provide full freedom to consumers and investors is welcome;
- Imposition of all grid charges on OPEX projects and change in definition of “captive” projects makes third party sale model a non-starter;
- States are devising ever new ways of suppressing distributed renewables, particularly the C&I market, to protect DISCOMs;
Most states impose multiple size ceilings linked to distribution transformer capacity, power consumption, and connected load of consumers on top of an overarching system size cap of 500 kW or 1 MW on rooftop solar systems under net metering policies. The decision to do away with project capacity constraints is therefore highly welcome. It provides freedom to consumers and investors to size solar projects depending on their assessment of project viability and power consumption profile.
Another seemingly positive change is that projects developed under OPEX model can now avail grid connectivity unlike under the earlier policy. However, such projects shall bear all grid charges including CSS and AS making the model a non-starter. This is the first time that these charges are being applied to rooftop solar installations anywhere in the country. The change has adverse implications as most consumers have an overwhelming preference for OPEX model particularly in times when they are financially stretched and keen to conserve capital.
The new policy does away with conventional definition of net or gross metering. Instead, it allows banking for all projects but subject to severe restrictions (daily or monthly basis depending on connection voltage for C&I consumers and only within specified day hours) and payment of INR 1.10-1.50/ kWh banking charge by C&I projects.
One of the most contentious provisions relates to new definition of “captive” projects. Only wholly owned projects will be considered as captive projects – in contravention to the Electricity Act, which specifies ownership threshold at only 26% for captive projects. There are profound implications of this provision. The open access market has moved almost entirely to third-party model with 26% equity ownership by consumers to avoid CSS and AS. The legal sanctity of the change is questionable. But it means that third-party sale projects are now unviable (see chart below). If other states follow Gujarat’s lead, open access market would face grim prospects.
Figure: Landed cost of open access solar power, INR/ kWh
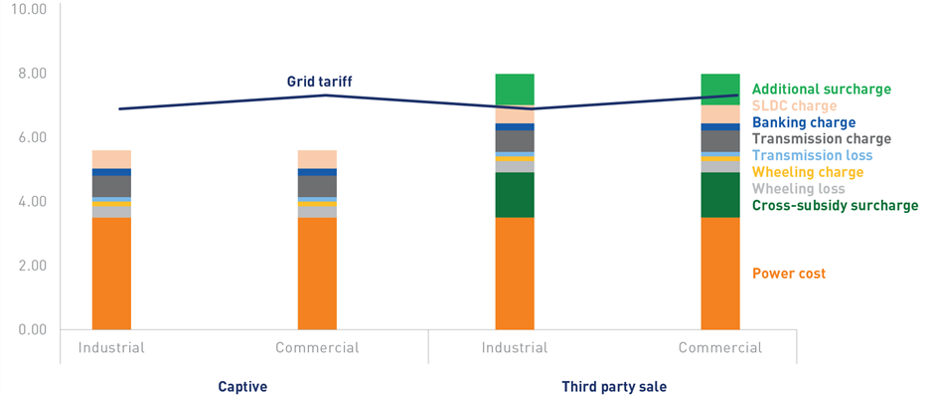
Source: BRIDGE TO INDIA Research
Note: This chart shows landed cost for an HT power consumer, connected at 33 kV, and served by PGVCL, one of the state DISCOMs. Grid tariff includes only variable energy charge and electricity duty. It does not include fixed charges.
The policy again demonstrates how states are devising ever new ways of suppressing distributed renewables particularly the C&I market to protect DISCOMs. It breaks new ground by imposing various charges on rooftop solar installations and coming up with a new definition of “captive” projects. Given the magnitude of some of these changes, we expect a legal challenge to the policy creating an extended period of uncertainty for the state’s renewable market.


