


BRIDGE TO INDIA is launching India Solar Price Indices, a series of indices to track and monitor key price trends in the Indian solar market. Our objective is to publish pricing data specifically applicable to the Indian solar market – devoid of exchange rate movements or source of equipment. We expect the indices to bring more transparency to the sector and provide reliable, independent information to all key stakeholders including government and regulators, financial institutions, developers, equipment suppliers and contractors.
We plan to release updated price indices every quarter across for four categories:
- Modules
- Inverters
- Utility scale EPC cost (excl land and transmission connectivity costs)
- Rooftop solar EPC cost
Methodology
We aim to get pricing information by conducting interviews with a diversified group of 6-10 leading project developers, EPC contractors and module suppliers. Final pricing is obtained by taking a simple average of all responses while ignoring any outliers.
BTI India Solar Module Price Index
This index aims to provide pricing information for multi-crystalline PV modules from tier 1 Chinese suppliers for delivery in the next 3 months with a minimum order size of 50 MW.
Based on the methodology described above, our module price index for March 31, 2017 is INR 22/ Wp (US 33¢/ Wp). This price is CIF India, net of any further port or inland transportation costs.

Note: Prices for past quarters are based on BRIDGE TO INDIA research.
Module prices have been falling steeply due to oversupply and quarterly demand fluctuations in China. Prices have declined 29% y-o-y and 8% over the last quarter.
BTI India Solar Inverter Price Index
This index aims to provide pricing information for central inverters assembled in India for delivery in the next 3 months for a minimum order size of 50 MW.
Based on the methodology described above, our inverter price index for March 31, 2017 is INR 1.9/ Wp. This price is CIF India, net of any further port or inland transportation costs.
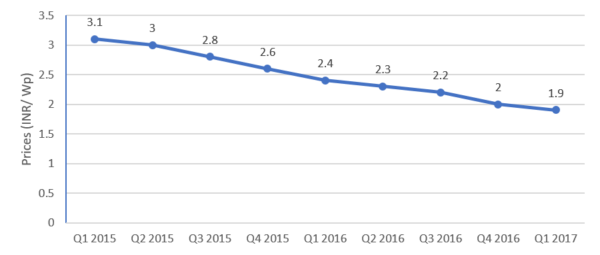
Note: Prices for past quarters are based on BRIDGE TO INDIA research.
Inverter prices have fallen considerable in last two years because of increasing competition and entry of new players like TBEA, Huawei and Sungrow. Prices have declined 21% y-o-y and 5% over the last quarter.
BTI India Solar EPC Price Index
This index provides lumpsum EPC price information for utility scale solar projects of 50 MW size. The price excludes land, transmission infrastructure and all soft-development costs.
Based on the methodology described above, our EPC price index for March 31, 2017 is INR 35/ Wp.

Note: Prices for past quarters are based on BRIDGE TO INDIA research.
EPC prices have declined 22% y-o-y and 8% over the last quarter.
BTI India Solar Rooftop EPC Price Index
This index provides EPC price information for a 500 kW rooftop solar project on an industrial pre-fabricated metal structure. Our rooftop solar EPC price index for March 31, 2017 is INR 45/ Wp.

Note: Prices for past quarters are based on BRIDGE TO INDIA research.
Rooftop EPC prices have declined 21% y-o-y and 6% over the last quarter.


