Loading...

OPEX market continues to gain share but for how long?


31 January 2019 | Jyoti Gulia

OPEX market continues to gain share but for how long?

Rooftop solar market in India has seen share of OPEX model increase from barely 2% in 2012 to an estimated 35% as of September 2018. The model is growing rapidly as it is very attractive particularly for the C&I consumers – they make assured cost savings over grid power without any upfront capital investment. Plus, system installation and operation responsibility lies with specialist third party developers who have an incentive to ensure better quality and reliability.

We expect the share of OPEX model to continue to increase in the medium term and peak at it around 40% by 2020.

Figure: Capacity addition trends in the Indian rooftop solar market

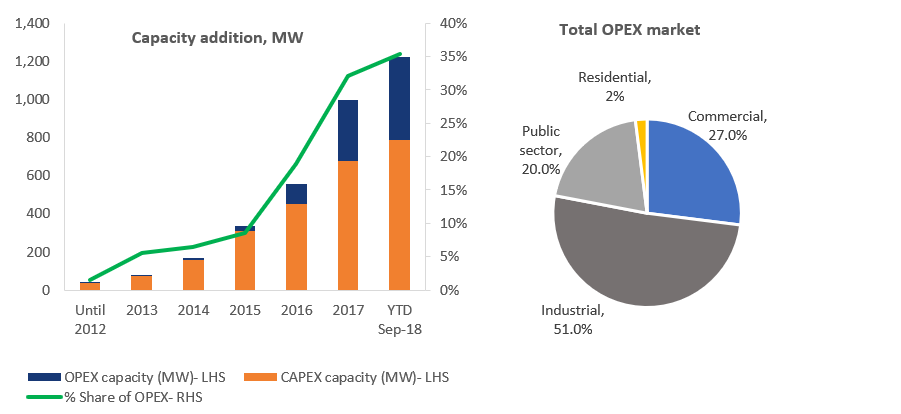
Source: BRIDGE TO INDIA research

C&I consumer segment dominates the OPEX market with 78% share. The project developers prefer C&I consumers because of larger installation size (typically > 500 kW) and comfort on their long-term credit risk. Public sector consumers account for 20% share of OPEX market. Many central and state government agencies are aggregating demand from such consumers and issuing large tenders. However, progress so far has been slower than expected because of complex tender based processes and on-site execution challenges.

Residential OPEX market has still not taken off unlike in some of the western countries because of poor financial incentive for such consumers to adopt rooftop solar (low grid tariffs), poor scalability and high execution challenges.

Longer term, we believe that OPEX market share would peak at about 40% and start declining thereafter as capex costs continue to fall and consumers gain more awareness about technical and operational aspects of installing rooftop systems. This market is also bound to face growth challenges over time as the number of acceptable credit worthy C&I consumers is limited.


Recent reports

India Solar Map | December 2023

India Solar Map | December 2023

India Solar Map 2023 is an info-graphic report covering growth of utility scale solar sector – national and state-wise commissioned and pipeline capacity, leading market players and portfolio details of top 16 project developers. Capacity addition in 2023 fell 51% YOY to 5,924 MW taking total utility scale solar capacity to 59,840 MW. Total project pipeline stands at a record 74,161 MW.

India Corporate Renewable Brief | Q4 2023

India Corporate Renewable Brief | Q4 2023

This report provides an update on key trends and developments in the corporate renewable market including capacity addition, key players, policy & regulatory issuance, financing, PPA tariffs and other market trends.

India PV Module Intelligence Brief | Q4 2023

India PV Module Intelligence Brief | Q4 2023

This report captures quarterly trends in module demand and supply, import and domestic production volumes, supplier market shares, break-up by technology and rating, global market scenario, pricing trends across the value chain, key policy developments and market outlook.

India Solar Compass | Q4 2023

India Solar Compass | Q4 2023

This report provides a detailed update of all key sector developments and trends in the quarter – capacity addition, leading players, tenders and policy announcements, equipment prices, financial deals and other market developments. It also provides market outlook for the next two quarters.

Inter-state OA — opportunities and challenges

Inter-state OA — opportunities and challenges

Inter-state transmission system (ISTS) open access (OA) renewable market is growing strongly on the back of multiple drivers including a waiver from ISTS charges together with decarbonisation pressure on corporates and streamlined transmission connectivity approval process. However, the ISTS route savings are viable only for projects commissioned by June 2026 (at least 75% ISTS charge waiver).

India Corporate Renewable Brief | Q3 2023

India Corporate Renewable Brief | Q3 2023

This report provides an update on key trends and developments in the corporate renewable market including capacity addition, key players, policy & regulatory issuance, financing, PPA tariffs and other market trends.

To top