


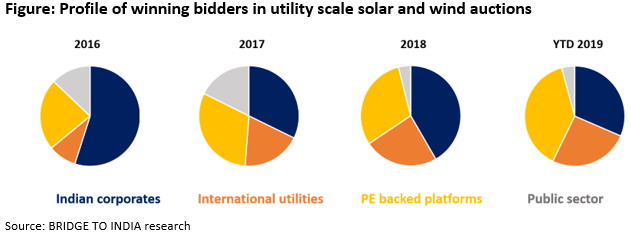
A quick look at the profile of winning bidders in utility scale wind and solar auctions over last three years throws some pointed results. The role of international investors – utilities, developers and financial investors (pension funds, sovereign wealth funds, PE funds) – is becoming more critical. Their combined share has gone up steadily from 32% in 2016 to 65% in YTD 2019. Indian investors – large and small – are being squeezed out of the market as project sizes increase and risk-return equation becomes unfavourable.
- International utilities and pension and sovereign wealth funds have been attracted by the large size of Indian RE market but they remain cautious investors;
- With many Indian investors unwilling or unable to compete in the sector, the number of winning bidders has gone down by 70% in the last three years;
- India needs to attract new pools of capital for meeting the needs of its energy sector;
In a capital-intensive sector, the dominance of large international investors is not altogether surprising. Capital cost per MW has fallen sharply (for solar) but that has been accompanied by significant increase in project sizes. Average bid size has more than doubled from 71 MW in 2016 to 153 MW in YTD 2019.
There are other factors explaining this shift. International utilities (Engie, EdF, Enel, Fortum, CLP, Sembcorp) and pension and sovereign wealth funds (CDPQ, CPPIB, GIC, ADIA, CDC) have been attracted to the world’s fastest growing energy market and a desire to invest in alternative energy. In an intensely competitive bidding market, they have been able to grow their presence by accepting low returns (and low risk). The PE investors, on the other hand, have taken an aggressive development approach with a 3-5 year exit strategy as exemplified by Actis (Ostro Energy) and AT Capital (Orange Power).
So far, so good. But the evolving nature of the market is also partly attributable to unwillingness or inability of even the largest Indian investors (Tata Power, Aditya Birla, Mahindra, Reliance, Jindal) to compete with their international counterparts. In other words, the project development business is losing depth. The number of winning bidders has gone down by 70% in the last three years. We believe that this trend is unsustainable and should be a worry for the policy makers. International investors are highly risk averse and could be spooked by rising instances of DISCOM payment delays, policy reversals, PPA renegotiation attempts and tender cancellations. A shallow market is also more prone to external shocks including currency movements, war and international trade restrictions.
There are 23,687 MW of tenders in the bidding pipeline. The aim is to build out over 100,000 MW of RE capacity and allied infrastructure necessitating investments over USD 70 billion in the next five years alone. India needs to attract new pools of capital for transforming its energy sector and achieving its geo-political objective of higher energy security. That requires shifting focus from reducing tariffs to offering a better risk-return profile to investors.


