Loading...

2018 ends on a low note

2018 ends on a low note


12 March 2019 | Arti Mishra Saran

2018 ends on a low note

BRIDGE TO INDIA has released its quarterly market report – India Solar Compass Q4 2018. The report contains detailed analysis of solar capacity addition, tender issuance, leading market players, prices and other market trends for the last quarter as well as our estimates for the next two quarters.

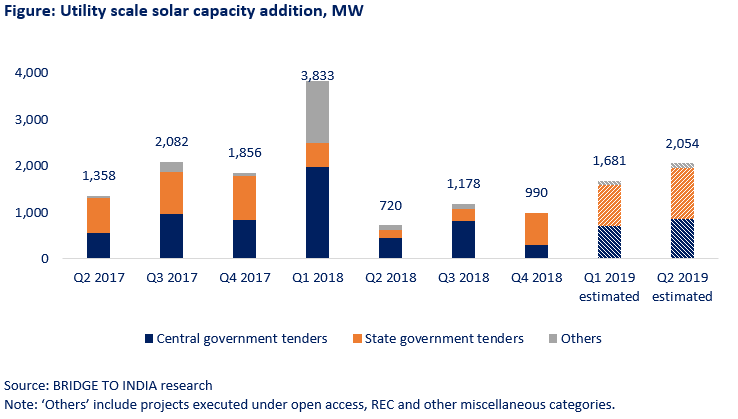
Only 1,446 MW capacity was added in Q4 2018 – 990 MW utility scale solar (68%) and 456 MW (32%) rooftop solar. Utility scale solar capacity addition has been sluggish since Q2 2018 and was down 46% over Q4 2017. In contrast, rooftop solar is growing strongly and is up 47% y-o-y. Total installed solar capacity has reached 28,057 MW in the country, split between 24,202 MW utility scale solar and 3,855 MW rooftop solar.

A few other highlights from the report:

  1. There was an unprecedented spike in tender issuance with 51,118 MW of new tenders in the year (15 GW issuance in Q4 alone);
  2. Floating solar, solar-wind hybrid and storage tenders picked up pace in 2018;
  3. Project pipeline reached 17,658 MW as on December 31, 2018;
  4. Module prices fell to USD 0.20/ W in Q4, down 44% over previous year but a substantial part of this fall has been offset by safeguard duty, GST and fall in Rupee-USD rate;
  5. Adani (1,958 MW), Acme (1,801 MW) and Tata Power (1,300 MW) were the top three project developers in 2018;

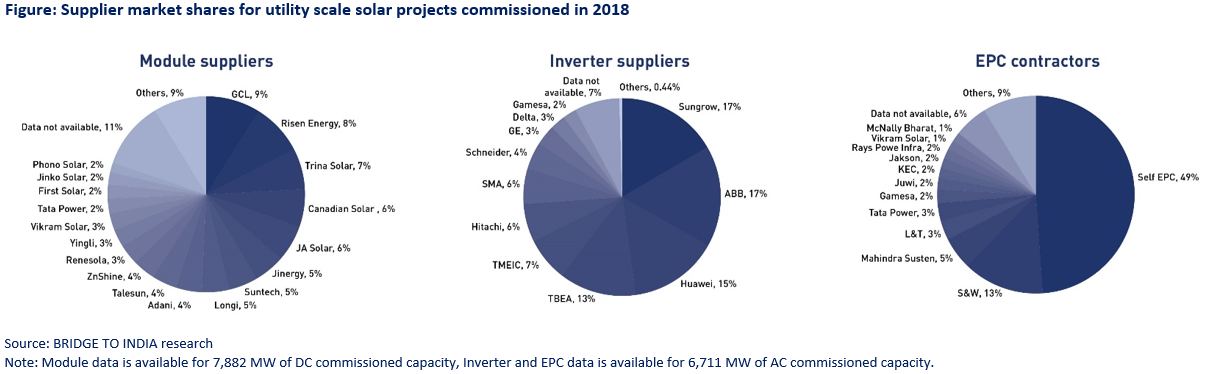
The market place continues to be very competitive with extensive churn in player rankings. For utility scale projects commissioned in 2018, GCL (704 MW), Risen Energy (668 MW) and Trina (531 MW) were the leading module suppliers, while Sungrow (1,114 MW), ABB (1,110 MW) and Huawei (982 MW) were the top three inverter suppliers. Self-EPC continues to be preferred heavily with nearly 50% share of the total market. Sterling & Wilson maintained its lead (894 MW), followed by Mahindra Susten (357 MW) and L&T (210 MW).

We expect a significant pick up in construction activity in 2019, however module prices are expected to stay firm or even harden marginally.


Recent reports

India PV Module Intelligence Brief | Q3 2024

India PV Module Intelligence Brief | Q3 2024

This report encapsulates quarterly trends in module demand and supply, import and domestic production volumes, supplier market share, break-up by technology and rating, global market scenario, pricing across the value chain, key policy developments and market outlook.

India Corporate Renewable Brief | Q3 2024

India Corporate Renewable Brief | Q3 2024

This report provides a quarterly update on key trends and developments in the corporate renewable market including capacity addition, key players, policy issuances, financing, equipment prices and other market trends.

India Renewable Compass | Q3 2024

India Renewable Compass | Q3 2024

This report provides a detailed update of all key sector developments and trends in the quarter – capacity addition, leading players, tenders and policy announcements, equipment prices, financial deals and other market developments. It also provides market outlook for the next two quarters.

India Solar Rooftop Map | June 2024

India Solar Rooftop Map | June 2024

India Solar Rooftop Map is an info-graphic report providing a snapshot of rooftop solar market in India – capacity addition across states and consumer segments, market share of leading players and other key trends. Total rooftop solar capacity is estimated to have reached 16,914 MW by June 2024. Total new installations in year-ending June 2024 are estimated at 4,151 MW, up a staggering 73% over previous year.

Powering up renewables with battery energy storage systems

Powering up renewables with battery energy storage systems

India’s battery energy storage systems (BESS) market is poised for significant expansion, driven by ambitious renewable energy (RE) targets and an increasing need for grid stability. Government initiatives and technological advancements are propelling this growth. However, supply chain risks and cost challenges remain.

India Renewable Map | June 2024

India Renewable Map | June 2024

This info-graphic report provides a complete overview of the renewable sector including solar and wind installed capacity, leading players and their market shares, tariff trends and other market trends. India’s total solar and wind capacity reached 117,085 MW by 30 June 2024. New capacity addition in the last 12 months was 14,238 MW, increased by 32% y-o-y.

To top