


India added total utility scale solar and wind capacity of 715 and 328 MW respectively in the quarter ending March. These are meagre returns; the combined total represents the weakest quarterly progress on capacity addition in the last two years. For the financial year 2019-20, total utility scale capacity addition was 7,408 MW, 34% below the high of two years ago.
- Progress over next two quarters is expected to remain dismal due to Coronavirus disruption;
- Faced with sharp demand slowdown and deteriorating financial condition, the DISCOMs are reluctant to sign long-term PPAs;
- The sector urgently needs a revised roadmap in view of the slumping power demand outlook, offtake concerns and challenges in tying up land and transmission connectivity;
Jan-Mar is usually the busiest quarter for project construction as developers and contractors rush to complete projects to claim depreciation and meet internal targets for the financial year. So the slow progress is doubly disappointing. Reasons for slow down are multiple and varied. A spate of challenges including delays in regulatory approvals of tariffs, transmission connectivity, debt financing and INR depreciation has affected project execution across the board.
Going forward, supply chain disruption due to Coronavirus would continue to severely affect progress in Q2. Project construction activity was allowed to commence from 20 April 2020 onwards but a further 6-8 weeks are expected to be lost in remobilisation effort and resolving shipment blockages. There may be further hold-ups depending on government approvals, or reopening of PPAs in case of open access projects.
Figure: Solar and wind capacity addition, MW
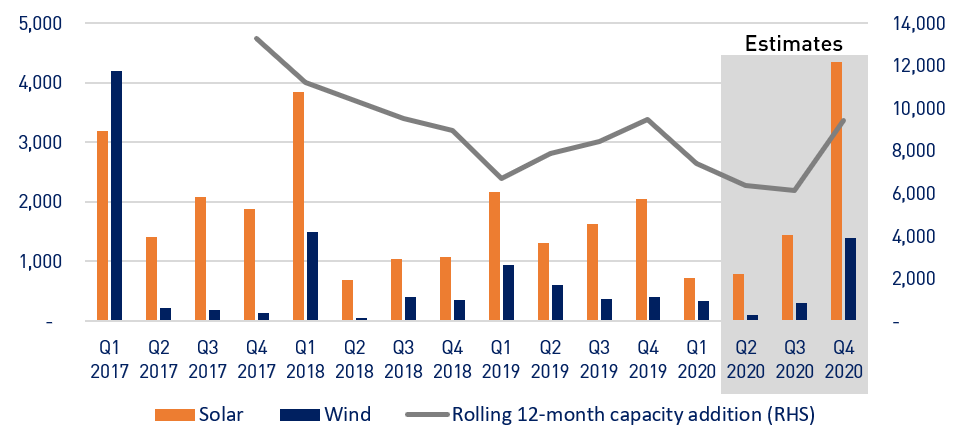
Source: BRIDGE TO INDIA research
Notes: Figures include open access projects but exclude rooftop solar and other distributed solar systems.
There are 37 GW of solar and wind projects currently in pipeline. Excluding 3 GW capacity in the manufacturing-linked tender, the remaining 34 GW is due for completion in the next two years. But we are skeptical if more than 24 GW can be added in this period in view of the various ongoing challenges. Faced with sharp demand slowdown and deteriorating financial condition, the DISCOMs are reluctant to sign PPAs and commit to long-term purchases. SECI is believed to be struggling to find buyers for the recently completed 1,200 MW peak power tender auction (weighted average tariff of INR 4.30/ kWh) and 4,000 MW manufacturing-linked projects (INR 2.92/ kWh).
Our most plausible renewable capacity estimate for March 2022 is 116 GW including rooftop solar and open access projects. These numbers are consistent with our recent study on 5-year outlook for the renewable sector. MNRE has been keen to rush out new tenders and auctions but should instead focus on finding decisive solutions to supply side constraints. Unless these factors are addressed, the sector would stay stuck in the third gear at 9-10 GW average annual capacity addition.


