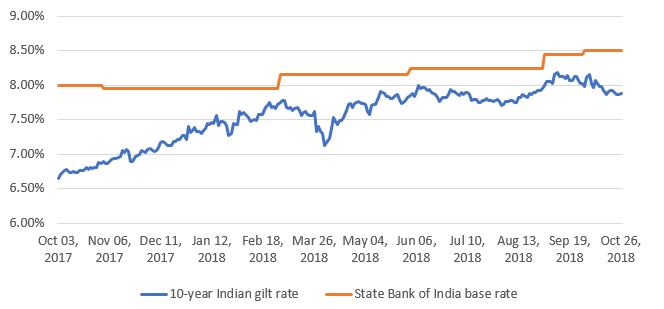
RE projects are facing increasing financing challenges. Liquidity in the Indian financial system has dried up considerably pushing up cost of debt finance by 1.0-1.5% over last year. To make matters worse, we understand that most private banks and non-banking finance companies (NBFCs) are unwilling to finance RE projects at present. Tough financing conditions are expected to pose a formidable challenge for about 10,000 MW of RE projects reaching financial closure stages.
- Financing difficulties are expected to persist at least until H1 2019;
- Small IPPs and developers are likely to be the worst affected as lenders shut down most new business;
- Expected impact on projects is completion delay of up to 3-6 months and/ or reduction in equity returns by about 1-2%;
Debt financing environment for RE projects had been relatively benign in the last few years. Despite rapid growth in capacity addition, project developers were able to raise total estimated debt of INR 420 billion (USD 5.8 billion) for the 12,000 MW of new utility scale capacity addition in 2017-18 relatively easily. Precise numbers are hard to obtain, but we estimate that more than 75% of the total requirement was met from domestic sources including Indian banks, financial institutions, NBFCs and local capital markets. Balance came mainly from international financing agencies (World Bank, ADB, IFC, KFW) and international capital markets. Despite project viability concerns in the face of falling tariffs, interest rates fell steadily to about 9.5%. Other terms and conditions including tenor also became progressively more favourable.
Figure: Indian interest rates

Source: BRIDGE TO INDIA research, www.investing.com
Private NBFCs – L&T Infrastructure Finance, IL&FS, Tata Cleantech Capital and Reliance Capital, amongst others – have been a key source of finance for the sector. We estimate that these NBFCs provide up to 20% of total debt funding for the sector. They play a vital role in the value chain by sanctioning loans quickly and aggressively down-selling to banks and FIs. A spate of bad news including concerns about asset quality, tightening liquidity and falling INR have led to crisis like conditions for NBFCs. This has, in turn, led the financial system to freeze and forced lenders to suddenly question viability of 20-year debt financing for RE projects.
We expect the financing challenges to persist for another 6-8 months, until general elections in H1 2019, at the minimum. Small IPPs and developers are likely to be the worst affected as lenders restrict new business to top-tier players. The news comes at a highly inconvenient time with developers already struggling with GST, safeguard duty, falling INR and rising commodity price risks.
How can the government help? MNRE is believed to be pursuing relaxation of priority sector lending norms for the sector but we think that is highly unlikely to happen. Instead, it should seek to address increasing concerns around DISCOM payment risk and grid curtailment.


